Science: Fish
Nisqually Delta Fish Monitoring
Pre-restoration fish baseline monitoring started in 2003 and was completed in 2009 through cooperative efforts of the Nisqually Tribe, Nisqually National Wildlife Refuge, Ducks Unlimited, and the USGS Western Fisheries Research Center (Ellings and Hodgson 2007). The first season of post-restoration data collection was completed in October 2010. The Nisqually Delta fish research is focused on assessing pre- and post-restoration fish community structure, salmonid spatial and temporal distribution, relative abundance of all fishes, and Chinook prey availability and diet composition. Primary fish sampling methods employed for both pre- and post-restoration monitoring include beach seining and fyke trapping. Lampara netting was used for the first time in 2010 to sample nearshore habitats that could not be sampled by beach seining and to increase overall sampling effort in the estuary. The Tribe and USGS Western Fisheries Research Center have also established a Chinook estuary growth rate, residence time, and life history diversity pre-restoration baseline through otolith sampling and analysis (Lind-Null, Larsen, and Reisenbichler 2008a, Lind-Null, Larsen, and Reisenbichler 2008b, Lind-Null and Larsen 2009, Lind-Null and Larsen 2010). Post-restoration otolith sampling is ongoing and will be used to determine if large scale estuary restoration influences Chinook estuarine growth and residence time.

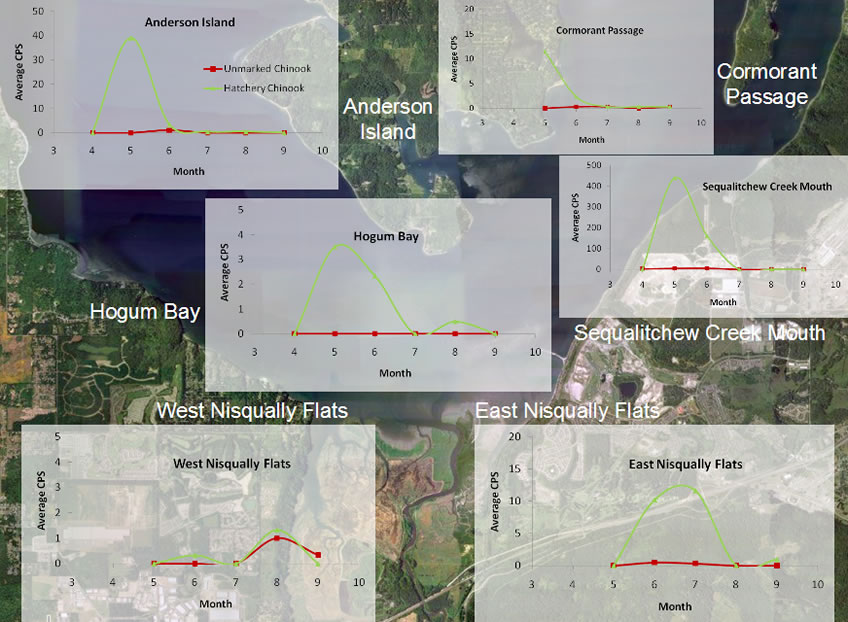
Average catch per set of unmarked (presumed natural) and hatchery Chinook captured by lampara netting in the Nisqually Estuary and adjacent nearshore habitats by month in 2010. Sites in close proximity were clustered into the above geographic zones. Lampara sites were sampled once a month, starting in April or May and going through September. Note that the scale of the Y axis varies.
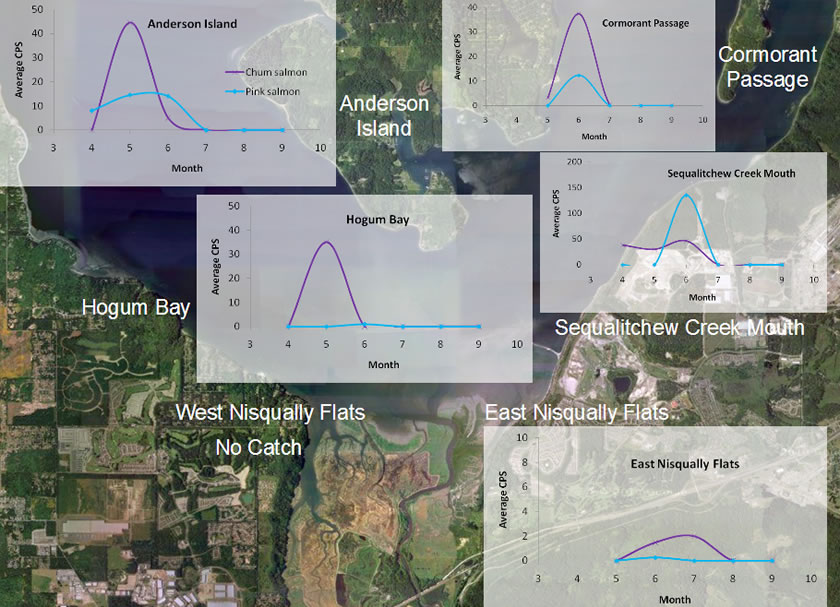
Average catch per set of chum and pink salmon captured by lampara netting in the Nisqually Estuary and adjacent nearshore habitats by month in 2010. Sites in close proximity were clustered into the above geographic zones. Lampara sites were sampled once a month, starting in April or May and going through September. Note that the scale of the Y axis varies.
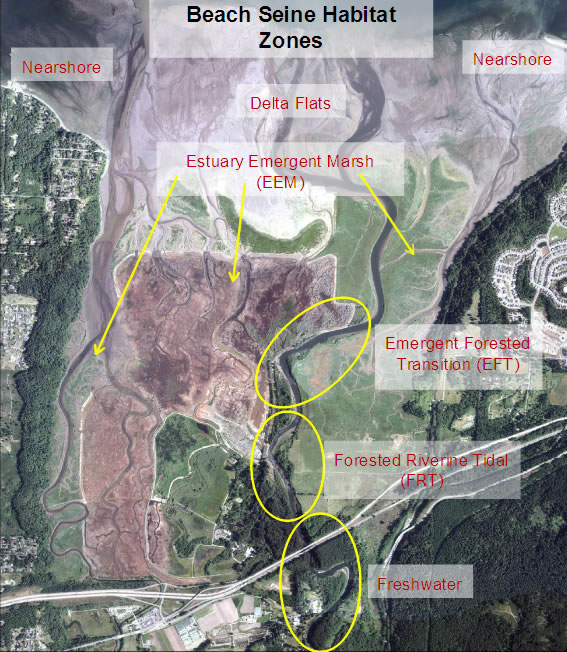
Habitat zones used to categorize beach seine sites throughout the estuary. Zones are defined by water salinity, the adjacent plant community, and the tidal regime. The aerial photograph was taken in July 2010.
Average catch per set of unmarked (presumed natural) and hatchery Chinook captured by beach seine in the Nisqually Estuary by month in 2010. Seine sites are grouped by habitat categories. Beach seining is the primary method used to assess the spatial and temporal use of the estuary by juvenile salmonids and other fishes. Approximately 20 sites are sampled twice a month February through October. Note that the scale of the Y axis varies.
Average catch per set of chum and pink salmon captured by beach seine in the Nisqually Estuary by month in 2010. Seine sites are grouped by habitat categories. Beach seining is the primary method used to assess the spatial and temporal use of the estuary by juvenile salmonids and other fishes. Approximately 20 sites are sampled twice a month February through October. Note that the scale of the Y axis varies.
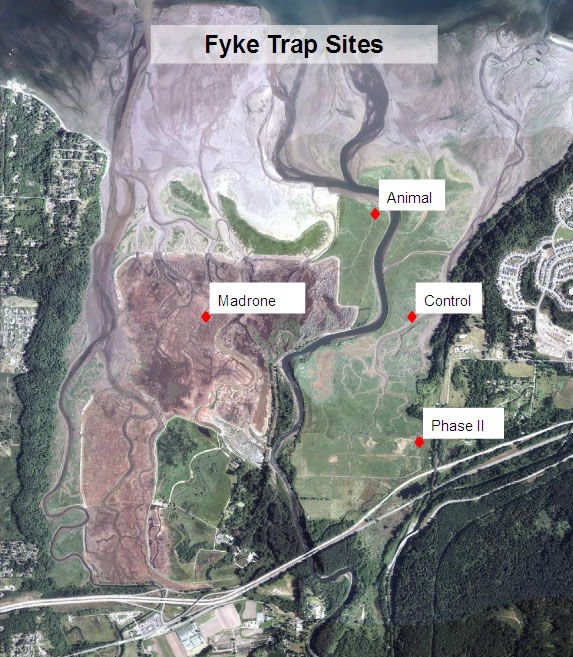
Location of our intensively monitoring sloughs within the Nisqually Estuary. Fish are sampled in the sloughs using a fyke trap set across the channel at high tide. The Madrone fyke trap is located within the restoring estuary. The Animal slough trap is located within an intact marsh adjacent to the Nisqually River and serves as a reference to the Madrone slough. The Control fyke site traps a slough within the intact Red Salmon Slough salt marsh. It serves as a reference for the Phase II fyke site, which traps the southern end of Red Salmon Slough within the Phase II restoration area. Tidal influence was restored to the Phase II area in 2006. The aerial photograph was taken in July 2010.
Total catch composition of each fyke trap in 2010. Fyke sites were trapped once monthly from March to July. Fyke trapping slough channels is the method we use to intensively monitor fish use of the estuary. A trap is placed across the slough channel at high tide and traps the channel as the tide drains. Using a fyke trap, we can estimate the density and species composition of fish in the slough channel. The diets of a small number of juvenile Chinook salmon captured in the fyke traps are analyzed and compared to the available invertebrate communities in the slough channels.
Nisqually Chinook Otolith Analysis
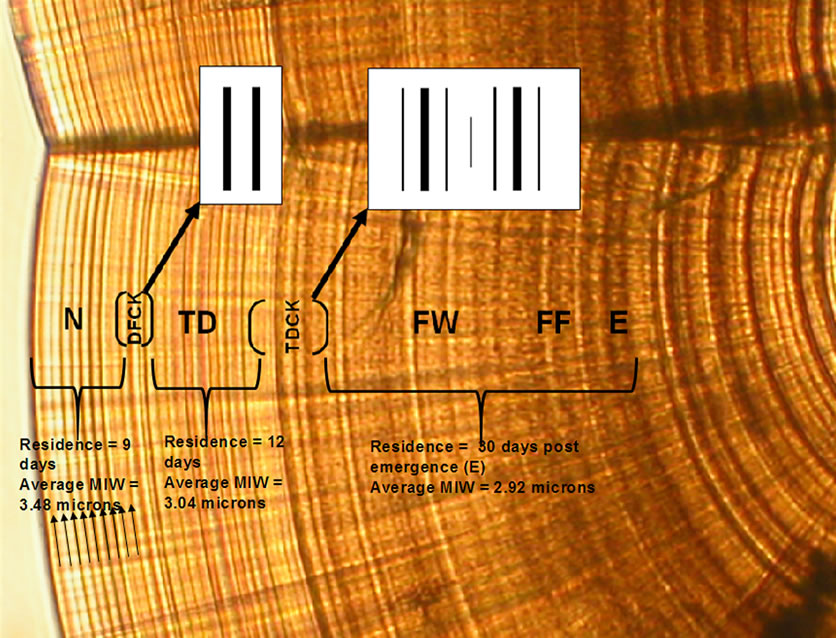
Representative processed otolith sample depicting the tidal delta (TDCK) as seen on a Nisqually unmarked juvenile Chinook salmon collected in the tidal delta habitat. Increments were consistently thin with narrow spacing across the radial axis until the TDCK appeared indicating a transition from the freshwater to tidal delta habitat. Beyond the TDCK, increments were consistently thicker and wider spaced indicating increased growth. Standard measurements between habitats such as otolith radial distances, mean increment widths (MIW) and increment counts can be taken to provide growth rates, residence times, and related information. Abbreviations: E=emergence, FF=first feed, FW=freshwater residence, TDCK=tidal delta check, and TD=tidal delta residence. 40x objective.
Nisqually Chinook Otolith Analysis: Pre-Refuge Restoration Growth Rates
Average complete tidal delta (estuary) growth rates for unmarked (natural) and hatchery juvenile Nisqually Chinook from 2004-2008. Growth rates are derived from otolith analysis.
Nisqually Chinook Otolith Analysis: Pre-Refuge Restoration Estuary Residence Times
Complete tidal delta (estuary) residence time (days), separated by year, for individual unmarked (natural) juvenile Nisqually Chinook from 2004-2008. No otolith samples in 2006 displayed a delta-flats check (DFCK).