Science: Tide Level
Click here for the latest tide level data »
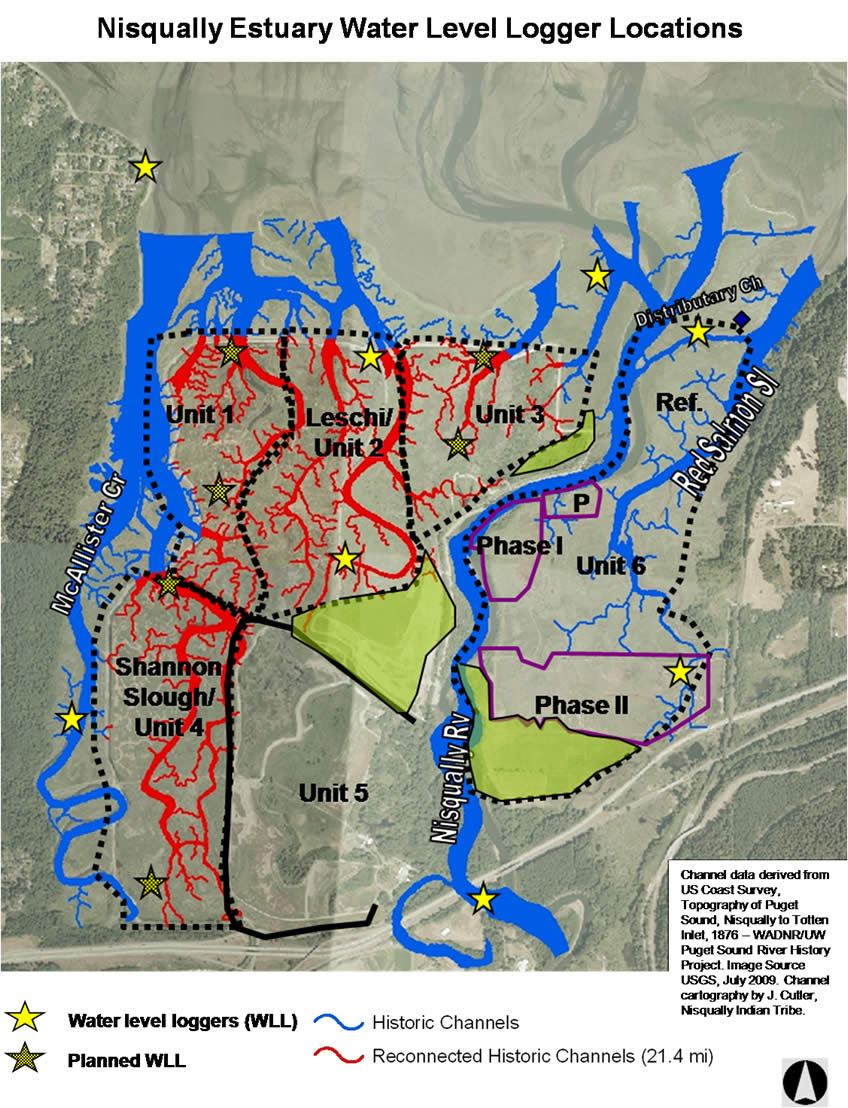
Along with freshwater inputs, the rise and fall of tides are the medium of energy exchange in estuary systems. They carry nutrients and sediment, create elevational and salinity gradients, and provide access to the marsh for fish and other aquatic organisms. Last summer, eight water level loggers were installed throughout the Nisqually Estuary. These loggers were placed in historic channels within the restoration site and three major waterways (Nisqually River, McAllister Creek and Red Salmon Slough) surrounding the restoration (Figure 1). Two loggers were installed on each waterway: one in the upper reaches of the river or slough and the other near the mouth where it empties into Puget Sound. Having water level loggers in both locations will enable us to compare the rise and fall of tides simultaneously at the mouth and upper reaches. The hydrographs created with these data will illustrate lag times between locations (if present) and at what tidal predictions the entire slough is completely inundated and evacuated. Tidal hydrodynamics will be compared inside and outside of the restoration and also between predicted tides at NOAA’s Dupont Wharf, Nisqually Reach tidal gauge station.
Tide levels are monitored continuously with water level loggers (Solinst and Telog Instruments) and related to NAVD88 using referenced staff gages. Water level loggers will be in continuous operation, recording mean, high, and low readings at 15-min intervals. Six more water level loggers will be installed within the restoration area this winter (Figure 1).
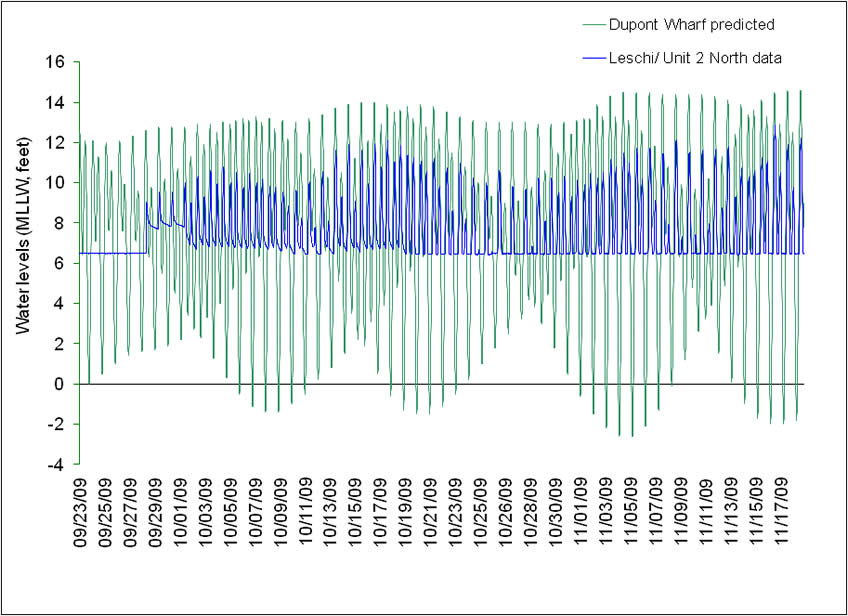
The hydrograph below details early changes to Leschi Slough after the re-introduction of tidal flow last September (Figure 2). Prior to dike removal, tidal influence was non-existent as indicated by the flat blue line on the graph. The first Puget Sound tides entered the historic channel on September 28th at 3:40 pm during an incoming tide. The tidal range increased over the first week, but as of mid-November, still did not match the predicted tidal range for the region (green line). The average daily tidal range (daily max – daily minimum tide level) for Leschi Slough was limited to 4.3 feet between September 28th and November 19th, whereas, the Dupont Wharf predicted average daily tidal range was 13.6 feet during the same time period.
Nisqually Reach tidal gauge station.